We're pretty deep into the whole COVID thing. Where I am in the world, we've been in some variation of lockdown for nine months now. It has meant a lot of changes to my working life, but one of the larger changes to my workflow is that there's no longer a giant whiteboard mounted directly behind me. "Diagrams as code" tools such as PlantUML and Mermaid have gone some way towards filling the void, and I'll examine how far they go in helping me communicate software architecture.
Why did I like the whiteboard so much?
I think the main thing here is the speed of iteration. When scribbling out an architectural idea, there's usually a bit of back and forth. As long as the diagram is on the whiteboard still, it's easy to erase a few lines here and there and add a few elsewhere.
Using the drag and drop functionalities of tools such as LucidChart or Draw.io can work for this. With that said, I've suffered the indignity of a stray arrow magnetising itself to the wrong box. It's not the worst thing to happen, nor the hardest thing to fix, but I felt I could go faster.
Heaping praise on diagrams as code
Being able to delegate how the diagram looks to something else is a boon for my productivity. I know that I can smash out a diagram in Mermaid syntax and the diagram will look pretty good. Don't get me wrong - no graphics design awards are coming my way, but by and large, the diagram is correct and looks clean.
Here's a simple example that I wrote with Mermaid. Take the following scenario. Service A schedules a task to run at some point with an external service - think of some kind of process that can't be immediately actioned, such as a scheduled task. We're immediately told whether task scheduling worked. If all goes well, the job is eventually delegated to a worker, which carries out it's assigned task. Once that's done, the worker dispatches a webhook notification to service B, allowing us to do whatever further processing logic we need to. Now, I want to describe that using Mermaid syntax. This is what that looks like:
sequenceDiagram
   participant Service A
   participant External Service
   participant External Service Worker
   participant Service B
   Service A ->>+ External Service: createJob(notifyEndpoint, jobParameters)
   External Service ->>+ Service A: jobScheduleStatus(id, status)
   External Service -->>+ External Service Worker: startProcessingJob(id)
   External Service Worker ->>+ External Service Worker: processJob(id)
   External Service Worker ->>+ Service B: dispatchWebhookToNotifyEndpoint(notification)
   Service B ->>+ Service B: handleWebhook(notification)
And that produces a diagram that looks something like this1 :
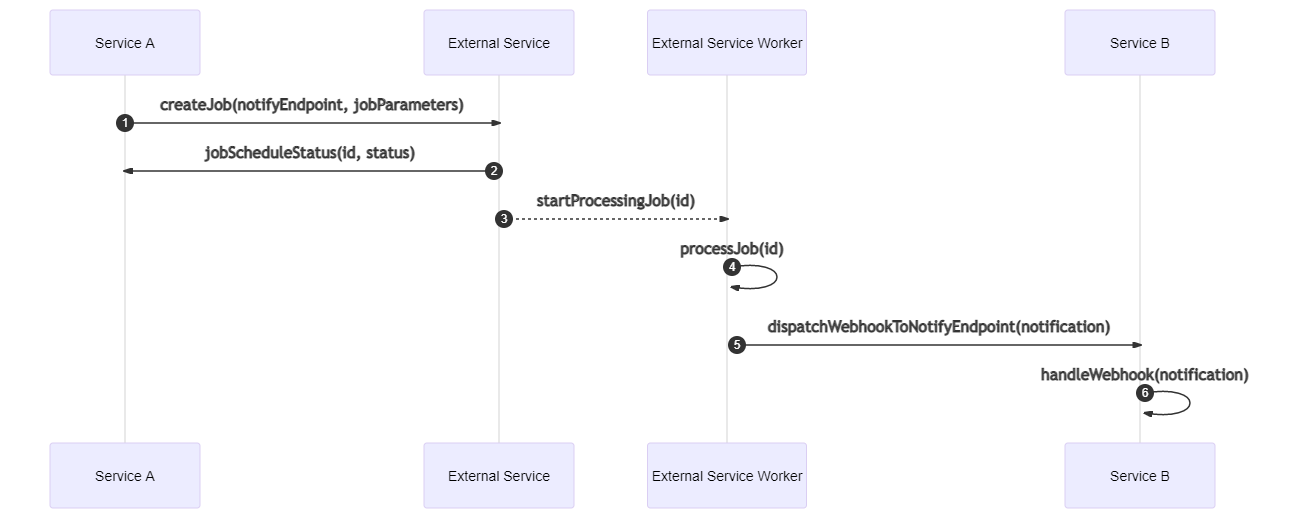
The sequence diagram allows me to express this chain of events tersely in code, but richly in the diagram. I'm able to quick and easily represent operational quirks. For instance, the initialisation of job processing is asynchronous. It doesn't occur immediately, but at some unspecified time in the future. In the diagram, I can express that with a dashed line, and in the code for the diagram, that's as easy as -->>+. Sequence numbers make it easy for me to discuss the diagram with other people, as we can refer to steps by their number. And to add them in was as easy as including a parameter when generating the diagram:
{
  "theme": "default",
  "sequence": {
    "showSequenceNumbers": true
  }
}
Now all the example is perhaps not the most powerful use case. It's a little simple, and it's not tricky to put together a diagram that looks like this with a GUI. In reality these diagrams have a fair bit more going on.
But putting it together in code feels a lot faster for me. The diagram is unsullied by my clumsiness at getting arrows to magnetise to the right box in a WSYWIG web GUI. And this whole thing took me two or three minutes to write - I spent more time coming up with the scenario. I can take the generated image and put it in a ticket, or a slack message, and use it as a visual aid for communicating my thought processes. Even though architectures are more complex in reality, I don't feel like a sense of not being able to express them using these tools.
What's interesting is that I'm more likely to be able to evolve this diagram over time. It doesn't rely on me preserving a whiteboard for all eternity. I can come back later, and make a quick tweak or edit, based on feedback or what have you. I write code every day, so as a method of building something - I'm used to it. Should I make a mistake, or if I want to make some tweak somewhere, I can do that without much fuss. I could even commit these into source control if I wanted to.
The ability to construct diagrams whilst sustaining speed, correctness and clarity are pretty much all I need. If I want to make a particularly pretty diagram (maybe it's for external eyes) I'd use the drag and drop tools. The more complex autogenerated diagrams tend to have a few visual quirks. But where I want the diagram to be evolvable, these tools fill the niche well. The hosted services that provide diagramming as a service see the value in these tools. For example, LucidChart supports its own flavour of syntax, and Draw.IO supports PlantUML and Mermaid syntax.
But does it replace a whiteboard?
Ish. Scribbling on a whiteboard feels faster still - at least for initial construction. And the back and forth with people when etching on a board feels easier.
But, I've gotten faster generating diagrams from code. The syntax for mermaid and PlantUML is pretty simple and easy to remember after a spot of practice. And in a way, it feels accessible in a different way to a whiteboard. We don't have to be in the same room to collaborate. The escape hatch here is that we can always switch to using the WSYWIG to construct the diagram instead. It's slower, but if someone's not up to speed with the syntax and it's not worth them getting up to speed, it's an option.
And beyond that, it lets me get a head start on any artefacts we need for documentation. Producing a quick diagram in the planning phases of a ticket that I can evolve later into something more formal is a big win for sure.
Calling It
Constructing diagrams as code does not replace everything a whiteboard does for me. But it's fast enough, it's easy to get started, and it makes it easy to involve remote people. If everyone knows the syntax, remote collaboration is easy, and you've still got the escape hatch of WSYWIG tools, though they feel slower to use.
I have found that a quick sequence diagram, to help communicate a mental model of a solution can grease the wheels of progress a great deal.
Unfortunately this doesn't render super legibly on mobile, for which I apologise. However you should be able to make out the key elements I discuss.